Rate of Change
Connecting Slope to Real Life
Why do we need to find the slope of a line in real life?
The slope of a line tells us how something changes over time. If we find the slope we can find the rate of change over that period.
This can be applied to many real life situations.
Take a look at the following graph.
This graph shows how John's savings account balance has changed over the course of a year. We can see that he opened his account with $300 and by the end of the first month he had saved $100. By the end of the 12 month time span, John had $1500 in his savings account.
John may want to analyze his finances a little more and figure out about how much he was saving per month. This is called the rate of change per month.
By finding the slope of the line, we would be calculating the rate of change.
We can't count the rise over the run like we did in the calculating slope lesson because our units on the x and y axis are not the same. In most real life problems, your units will not be the same on the x and y axis. So, we need another method!
We will need to use a formula for finding slope given two points.
Slope Formula

If you've never used this formula before, please visit our page on using the slope formula.

Let's take a look at John's graph again. John would like to find out how much money he saved per month for the year.
In other words, John wants to know the rate of change per month. We are finding out how much John's account changes per month (on average).
We see that his starting balance is $300. On the graph, this point is (0,300)
His ending account balance (on month 12) is $1500. This point is (12, 1500).
Therefore, our two ordered pairs are (0,300) and (12, 1500).
We can now use the slope formula to find the slope of the line. The slope is the rate of change from one month to the next.
Take a look at how this can be solved.

The slope is equal to 100. This means that the rate of change is $100 per month.
Therefore, John saves on average, $100 per month for the year.
This gives us an "overview" of John's savings per month.
Let's take a look at another example that does not involve a graph.
Example 2: Rate of Change
In 1998, Linda purchased a house for $144,000. In 2009, the house was worth $245,000. Find the average annual rate of change in dollars per year in the value of the house. Round your answer to the nearest dollar. (Let x = 0 represent 1990)
For this problem, we don't have a graph to refer to in order to identify the two ordered pairs. Therefore, we must find two ordered pairs within the context of this problem.
I am given information about the year in which Linda purchased a house and the amount that the house is worth. Since these two items are related, I can write them as an ordered pair.
Special Note:
If time is involved (time of day, months, years...) it will always be your x coordinate!
Time is always an x value.
Another thing that I would like to point out is the statement (Let x = 0 represent 1990)
*Believe it or not, mathematicians don't like to work with large numbers. So, instead of working with the actual year, we are going to use a substitution. It says, let x = 0 represent 1990. This is most likely the initial year or the year the house was built.
The substitutions are as follows:
0 = 1990
1 = 1991
2 = 1992
3 = 1992
And so on...
Let's solve.
Solution
Let x = year
Let y = amount
Step 1: Write two ordered pairs:
(8, 144,000) (In 1998, she purchased the house for $144,000)
(19, 245,000) (In 2009 (19 years after 1990) the house is worth $245,000)
Step 2: Use the slope formula to find the slope.
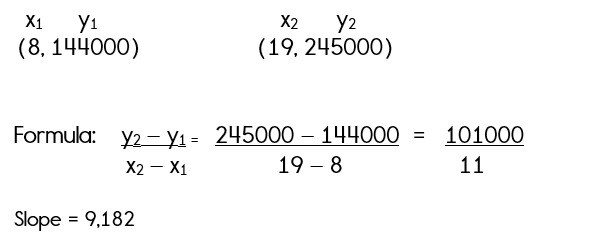
Linda's average annual rate of change if $9,182 dollars per year.
This means that on average, the value of her house increased by $9,182 dollars per year.
Now let's take a look at one more example where all we are given is a graph. We must pay close attention to the graph in order to solve the problem.
Let's take a look.
Example 3: Analyzing a Graph to Determine Rate of Change

The following graph represents Karen's Marathon.
1. What is the rate of change for interval A?
2. Explain what you think may have happened during interval C.
3. If the rate of change for interval A had remained constant throughout the whole marathon, how long would it have taken Karen to finish the marathon? (There are 26 miles in a marathon).
Solution
1. What is the rate of change for interval A?
Notice that interval is from the beginning to 1 hour.
Step 1: Identify the two points that cover interval A.
The first point is (0,0) and the second point is (1,6).
Step 2: Use the slope formula to find the slope, which is the rate of change.

2. Explain what you think may have happened during interval C.
During interval C, Karen took a break and stopped running. During that 1/2 hour time period, her distance did not increase.
3. If the rate of change for interval A had remained constant throughout
the whole marathon, how long would it have taken Karen to finish the
marathon? (There are 26 miles in a marathon)

The three examples above demonstrated three different ways that a rate of change problem may be presented.
Just remember, that rate of change is a way of asking for the slope in a real world problem. Real life problems are a little more challenging, but hopefully you now have a better understanding.

Need More Help With Your Algebra Studies?
Get access to hundreds of video examples and practice problems with your subscription!
Click here for more information on our affordable subscription options.
Not ready to subscribe? Register for our FREE Pre-Algebra Refresher course.


Need Help? Try This Online Calculator!
Affiliate Products...
On this site, I recommend only one product that I use and love and that is Mathway If you make a purchase on this site, I may receive a small commission at no cost to you.
Comments
We would love to hear what you have to say about this page!