Using a Table of Values to Graph Linear Equations
You can graph any equation using a table of values.
A table of values is a graphic organizer or chart that helps you determine two or more points that can be used to create your graph.
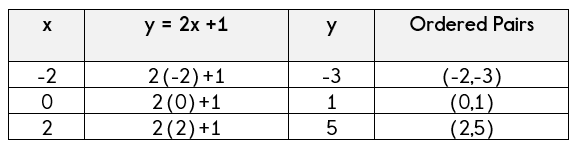
Here is an example of a table of values for the equation, y= 2x + 1.
Why Use a Table of Values?
In order to graph a line, you must have two points. For any given linear equation, there are an infinite number of solutions or points on that line.
If you just find two of the solutions, then you can plot your two points and draw a line through. This will be the line that represents the equation. Every point on that line is a solution to the equation.
In my table, I have 4 columns as described below:
- The first column is for the x coordinate. For this column, I can choose any number I wish. Try to choose numbers that can be graphed on your graph. For example, if your x axis only extends to 10, don't choose 12 as an x coordinate.
- The second column is for substituting x into the equation in order to solve for y. So, whatever value I chose for x, I will substitute back into the equation and solve to find the y value.
- The third column is for the y value. After substituting your x value into the equation, your answer is the y coordinate.
- The last column is for your ordered pair. Your ordered pair is the x value and the y value. This is the point on your graph.
Let's look at a few examples, and it will all make more sense!
Example 1: Using a Table of Values

A Few Notes About Example 1
In this first example, I chose -2, 0, and 2 as my x coordinates.
After substituting those values into the equation: y = 2x +1, I found my y values to be: -3, 1, and 5.
Therefore, the ordered pairs that I found on my graph were: (-2,-3), (0,1), and (2,5).
I plotted those points on my graph.
I then used my ruler and drew a straight line through those points. This is the line for the equation, y = 2x +1.
If you had done this problem on your own, you may have found three different points using the table of values. That's ok, because even if your three points are different, your line will still look exactly the same!
We can also find other solutions for the equation just by reading the graph. I see that (3,7) is a point on the graph. If I substitute 3 for x into the equation, I will get 7 as my y coordinate.
This line goes on forever, so there are infinite solutions to the equation.
Let's look at another example.
Example 2: Dealing with Fractions

A Few Notes about Example 2
This equation, y = -1/2 x - 1 has a fraction as the coefficient of x. This becomes a little trickier in choosing x coordinates because we could end up with a fraction for the y coordinate. This then becomes a little more difficult to graph.
So, the trick is to look at the denominator of the coefficient. You want to choose x coordinates that are either multiples of the denominator or 0. 0 is the easiest choice. Then choose either the same value as the denominator or a multiple of the denominator.
Remember, you also have a choice of positive or negative numbers!
This will ensure that your y coordinate is an integer which is much easier to graph.
Tip:
If the coefficient is a fraction, choose 0 or a multiple of the denominator as your x coordinates!
Ok, one more example:

There are an infinite number of solutions for this graph, as the line goes on forever in both directions. Any point on this line is a solution to the equation.
A Few Notes About Example 3
This example has a slightly different direction, but involves the same process.
The problem asks for 3 solutions.
Remember, that when you find ordered pairs in your table of values, these are actually solutions to the equation.
There are other solutions, which are all of the other points on the line.
Any point on the line would be a correct answer to this problem.
Now you are going to learn about slope and y-intercepts to make graphing these equations much easier and quicker!

Need More Help With Your Algebra Studies?
Get access to hundreds of video examples and practice problems with your subscription!
Click here for more information on our affordable subscription options.
Not ready to subscribe? Register for our FREE Pre-Algebra Refresher course.


Need Help? Try This Online Calculator!
Affiliate Products...
On this site, I recommend only one product that I use and love and that is Mathway If you make a purchase on this site, I may receive a small commission at no cost to you.
Comments
We would love to hear what you have to say about this page!