Graphing Systems of Inequalities
What is a system of inequalities? A system of inequalities is two or more inequalities that pertain to the same problem. In order to solve the system, we will need to graph two inequalities on the same graph and then be able to identify the areas of intersection on the graph.
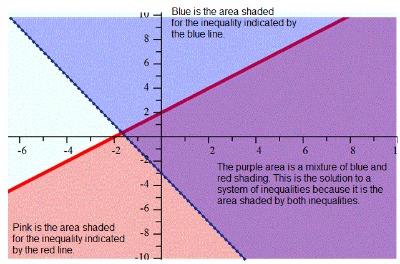
Take a look at a graph for a system of inequalities and then we will walk through a few examples step-by-step.
Notice how we still use solid and dotted boundary lines based on the inequality symbol. You will also use a test point and shade the half plane that contains all solutions, just as we discussed in the graphing inequalities lesson.
The only difference for this lesson will be that we must graph two inequalities on the same graph and then identify the area shaded by BOTH inequalities.
Let's take a look at our first example and this will make more sense.
Example 1: Systems of Inequalities
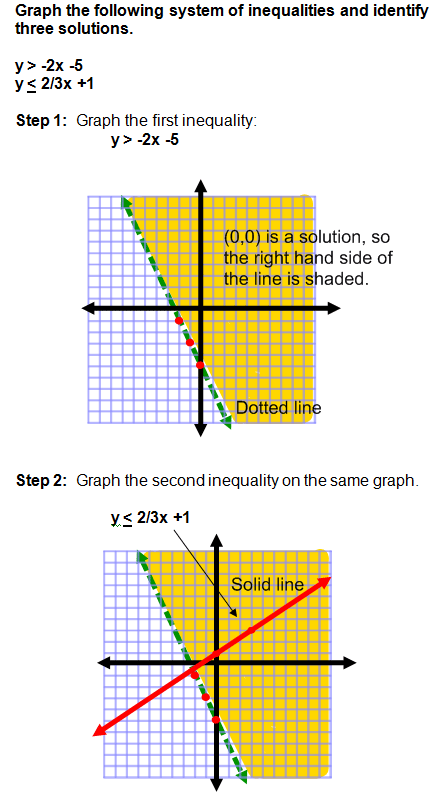
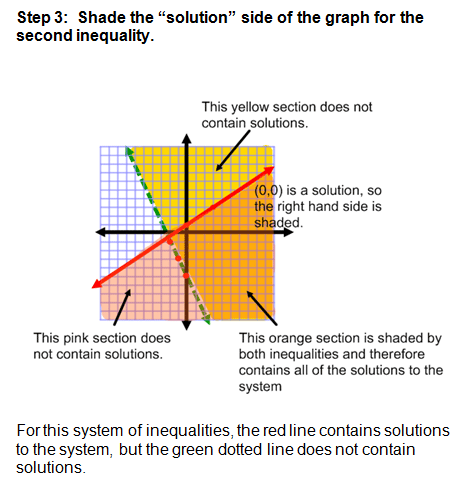
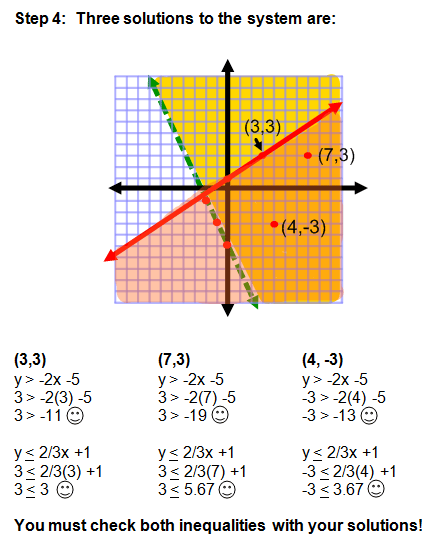
Not too bad, is it? It might help for you to have two different colored pencils if you are practicing along with me. If you don't have colored pencils, then you can draw horizontal lines for one inequality and vertical lines for the other. This will make it easier to see which area contains solutions for both inequalities.
Steps for Graphing Systems of Inequalities
- Graph the boundary line for the first inequality.
- Use a test point to determine which half plane to shade. Shade the half plane that contains the solutions to the first inequality.
- Graph the boundary line for the second inequality.
- Use a test point to determine which half plane to shade. Shade the half plane that contains the solutions to the second inequality.
- Analyze your system of inequalities and determine which area is shaded by BOTH inequalities. This area is the solution for the system of inequalities.
The next example will demonstrate how to graph a horizontal and a vertical line.
Example 2: Systems of Inequalities
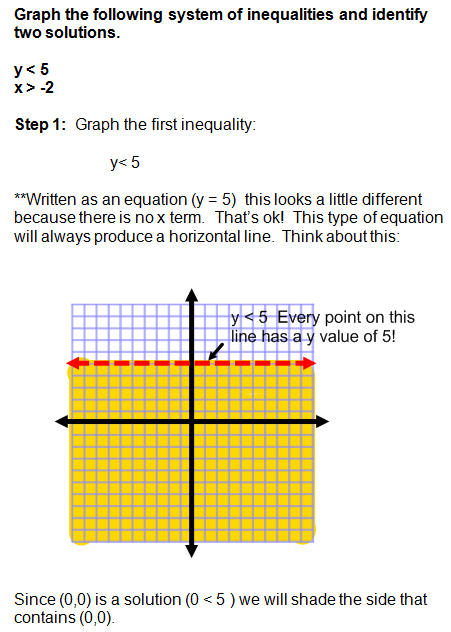
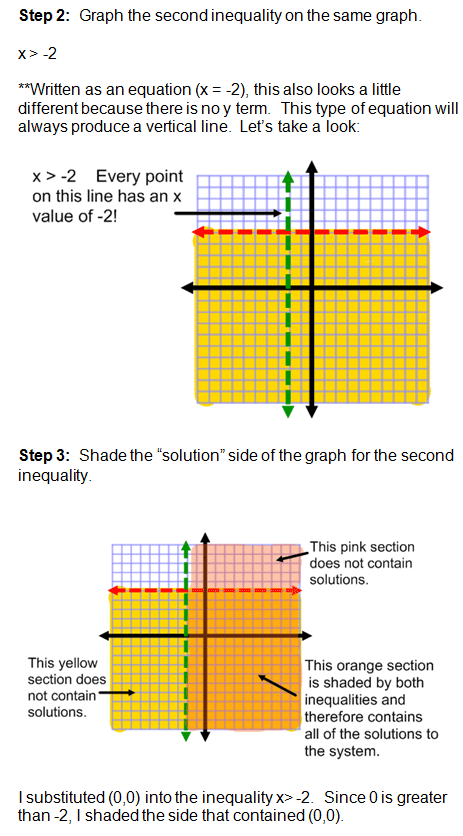

Example number two may have looked confusing at first because of the inequalities.
Remember that a horizontal line is always graphed when the equation or inequality begins with y = "a constant". A vertical line is always graphed when the equation or inequality begins with x = "a constant". Horizontal and vertical lines only have 1 variable.
Need more practice?

Need More Help With Your Algebra Studies?
Get access to hundreds of video examples and practice problems with your subscription!
Click here for more information on our affordable subscription options.
Not ready to subscribe? Register for our FREE Pre-Algebra Refresher course.
