Graphing Linear Inequalities
Practice Problems
How are you doing with graphing inequalities? Can you remember how to draw the boundary line and which side of the half plane to shade?
On this page, you will find two practice problems for graphing inequalities. Try them on your own and see how you do.
You may need to go back and review the examples on graphing linear inequalities.
Before you begin, let's review a few things!
Steps for Graphing Linear Inequalities
- Rewrite the inequality in slope intercept form if needed.
- Graph a dotted line if the inequality is greater than or less than.
- Graph a solid line if the inequality is greater than or equal to or less than or equal to.
- Substitute an ordered pair to determine which side of the line to shade. (0,0) is the easiest ordered pair to choose, if it is not on the line.
- Shade the side of the line that contains all of the solutions to the inequality.
- Check your work by substituting a point to determine whether or not it is a solution.
Ok... are you ready? Your turn to practice graphing linear inequalities.
Click here to print graph paper for your practice problems.
Practice Problems
1. y < -x - 4
2. y > 3x + 3
Now you must check your answers. If you had difficulty, check the steps below to help find where you are making your mistake. Remember that making mistakes is OK, as long as you learn from those mistakes. This is the reason why I feel that step by step answer keys are very important.
Solutions
The inequality in Example 1 is already written in slope intercept form. Therefore, you can graph the y-intercept at y = -4 and use a slope of -1 to find the next point.
Notice that we used a solid boundary line since the inequality symbol is "less than or equal to" in this problem.
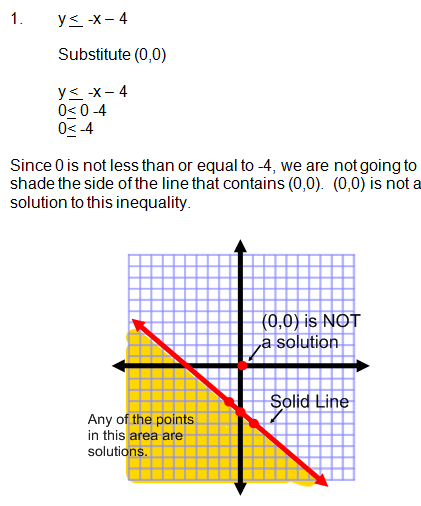
All of the points in the yellow shaded area are solutions to this inequality. You can choose any point in this area, substitute those values for x and y into the original inequality, and end up with a true math statement.
Problem 2
Problem 2 is already written in slope intercept form as well, so we can begin graphing the y-intercept at y = 3 and using a slope of 3 to find the next point.
Notice that we have a dotted boundary line this time because the inequality symbol is "greater than" in this problem. This means that solutions to the inequality are NOT included on the boundary line.
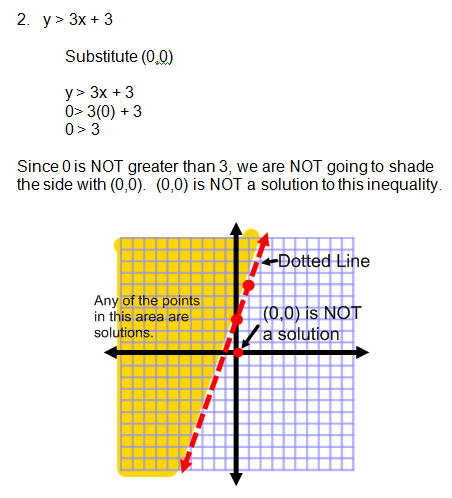
Since (0,0) is not a solution, we shaded the left hand side of the dotted line. This half plane contains all of the points that are solutions to this inequality.
Try it! Pick any point in the shaded area and substitute the values for x and y into the original inequality. Your math sentence should be a true statement with any point in the shaded area.
Great Job! You are doing great with graphing linear inequalities. Next we will study Systems of Inequalities.

Need More Help With Your Algebra Studies?
Get access to hundreds of video examples and practice problems with your subscription!
Click here for more information on our affordable subscription options.
Not ready to subscribe? Register for our FREE Pre-Algebra Refresher course.


Need Help? Try This Online Calculator!
Affiliate Products...
On this site, I recommend only one product that I use and love and that is Mathway If you make a purchase on this site, I may receive a small commission at no cost to you.
Comments
We would love to hear what you have to say about this page!